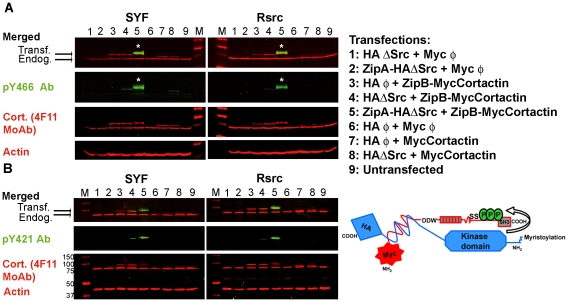
Figure 1. Efficient tyrosine phosphorylation of cortactin by Src in cells using the FIT system.
SYF and Rsrc cells were transfected with different combinations of Src and cortactin FIT fusion vectors (lanes 1–8) or left untransfected (lane 9). Cell lysates were blotted for actin as a loading control and with different Abs, then blotted with the respective conjugated secondary antibodies and finally visualized with the Odyssey system. The lysates were blotted with (A) pY466 or (B) with pY421 cortactin Abs. In both cases, we observed a clear specific phosphorylation band (in green) when ZipA-HA-ΔSrc and ZipB-MycCortactin were cotransfected (transfection 5), and this band superimposes (asterisks) on the cortactin band detected with the 4F11 MoAb (in red). Sizes of the molecular weight markers (denoted M) are shown in kDa. A schematic cartoon of the FIT system is shown.

