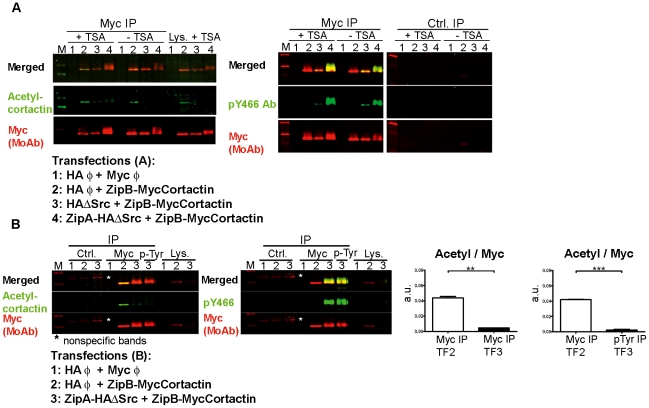
Figure 3. Analysis of acetylation and tyrosine phosphorylation of transfected cortactin.
(A) Lysates from various transfection combinations (lanes 1–4), treated or not with the deacetylase inhibitor Trichostatin A (TSA), were used to perform IPs using a myc MoAb that were examined by WB first with acetyl-cortactin Ab (in green) and second with myc MoAb (in red). The merge of both images is shown. After the membrane was gently stripped to remove the acetyl signal, it was blotted with pY466 Ab. The isotype control IP (Ctrl.) is also shown. (B) TSA-treated cell lysates from various transfection combinations (lanes 1–3) were subjected to parallel IP experiments with the myc MoAb and the generic pTyr MoAb. The IPs were blotted first with acetyl-cortactin Ab, and second with the myc MoAb; then the membranes were stripped and reprobed with pY466 Ab and myc MoAb. The asterisks denote non-specific bands. Quantification of the signals from cortactin immunoprecipitates showed a statistically significant inverse relationship between acetylation and tyrosine phosphorylation signals. a.u.: arbitrary units. *, p<0.05; **, p<0.01.

