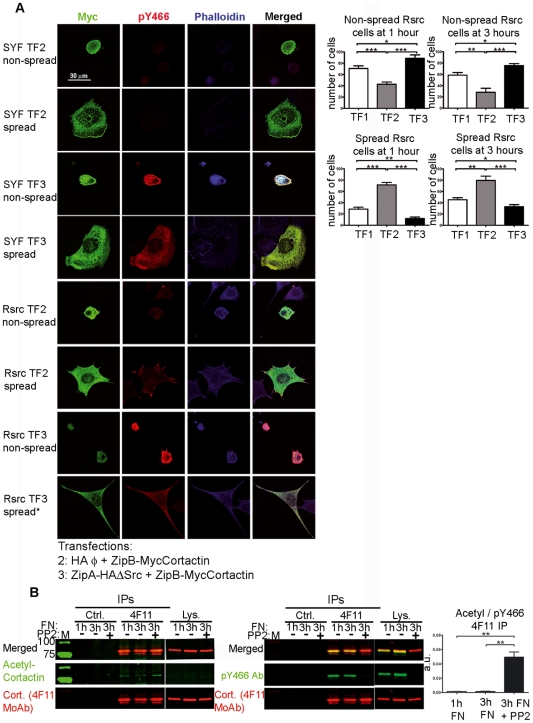
Figure 7. Tyrosine phosphorylation of cortactin affects cell spreading.
(A) SYF and Rsrc cells were transfected for 20 h with empty vectors (not shown), ZipB-MycCortactin and empty vector (TF2), or ZipB-MycCortactin and ZipA-HAΔSrc (TF3). Cells were then trypsinized, replated on fibronectin-treated coverslips, and fixed at 1 and 3 h. Pictures were taken in a confocal microscope at 600× magnification. Immunofluorescence staining was done using myc MoAb (in green), pY466 cortactin Ab (in red) and Alexa Fluor 350-phalloidin (in blue). For each experimental condition, a representative image of a non-spread and spread cell is shown. * Denotes that spreading of Rsrc cells is incomplete. Images were merged using Leica software. Scale bars are shown. A total of 100 transfected cells were quantified and classified into two categories: spread or non-spread. Statistical analysis from 7 independent experiments at 1 and 3 h after replating Rsrc cells is shown for tranfections TF1 (empty vectors), TF2 (cortactin) and TF3 (phosphorylated cortactin). *, p<0.05; **, p<0.01; ***, p<0.001. (B) Inhibition of cortactin phosphorylation increases its acetylation during cell spreading. Rsrc cells were replated on fibronectin (FN)-coated coverslips and allowed to spread for 1 or 3 h. A third plate was allowed to spread for 1 h and then treated with PP2 for 2 h. The lysates were subjected to IPs using isotype control (Ctrl.) MoAb or 4F11 MoAb and were blotted first with acetyl-cortactin Ab and second with anti 4F11 MoAb. After gentle stripping, the membrane was incubated with pY466 cortactin Ab and 4F11 MoAb. Quantification of the ratio of acetyl:pY466 cortactin signals indicated a significantly higher ratio after PP2 treatment. a.u.: arbitrary units. **, p<0.01.

