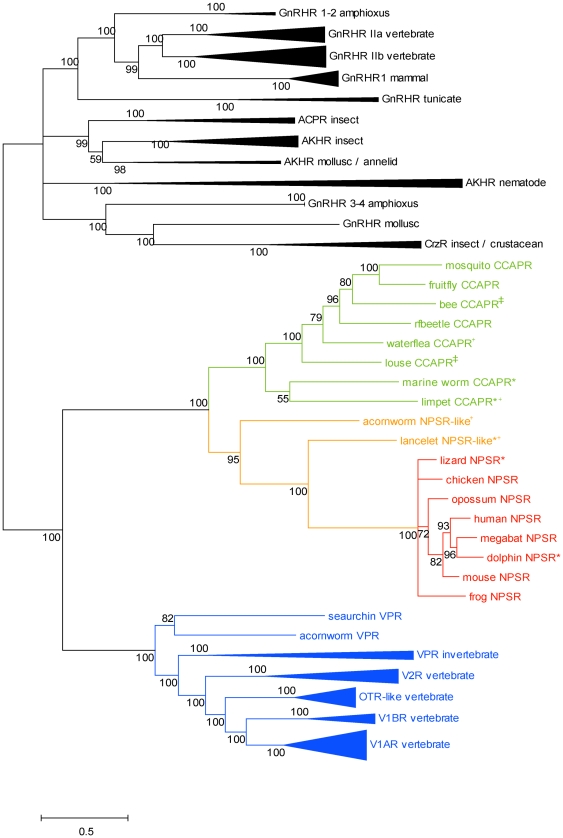
Figure 1. Phylogenetic relationship of the NPSR, CCAPR, GnRHR and vasopressin-like receptors from vertebrates and invertebrates.
Bayesian tree of NPSR (red), invertebrate NPSR-like receptor (orange), CCAPR (green), V1AR (blue), V1BR (blue), OTR (blue), V2R (blue), GnRHR (vertebrate and invertebrate Gonadotropin releasing hormone receptor) and VPR (invertebrate vasopressin-like receptor) (blue) sequences. The tree was generated using the Bayesian approach in MrBayes 3.1.2 using JTT+F+I+G model. Bayesian posterior probabilities are marked near branches as a percentage and are used as confidence values of tree branches. Nodes were compressed to represent the animal lineages. Scale bar represents the number of estimated changes per site for a unit of branch length. The receptor group abbreviations, names and accession numbers of the sequences and common and binomial names of the species are as listed in Table S2. In this figure and in Figure 4, the sequence names marked with * and +symbols represent manually corrected sequences at the N terminus and C terminus, respectively. Sequence names marked with ‡ symbol in this figure represent fragmented sequences.

