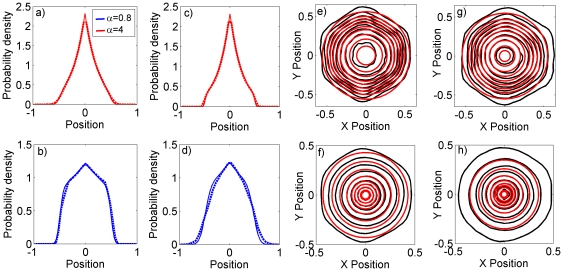
Figure 3. Comparison of the many-bodied simulation system and the reduced analytic model.
Saturation marginal probability distributions from simulations of systems of territorial central place foragers are overlaid on the same distributions (equations 8 and 9) from the reduced analytic models. Panels (a–d) compare the two distributions for the 1D system. Dashed lines denote the simulation output and solid lines the analytic approximation. The animal's central place (CP) is at position 0, whereas CPs of conspecifics exist at positions −1 and 1. The distribution decays to 0 at the conspecific CPs, where the animal cannot tread. The values used were (a)  ,
,  , (b)
, (b)  ,
,  (c)
(c)  ,
,  and (d)
  ,
,  . Panels (e–g) compare the two distributions for the 2D system. The black contours show the deciles (i.e. 10%, 20%, 30% etc.) of the height of the probability distribution for the simulation system. The red contours show the same quantities for the analytic approximation. The values used were (e)
  ,
,  , (f)
, (f)  ,
,  , (g)
, (g)  ,
,  and (h)
  ,
,  . As we increase
  or
or  , the effect of the adiabatic approximation becomes more apparent, since each red contour is further away from the respective black contour. This is due to the fluctuations of the territory border being more pronounced for higher
  or
or  .
.

