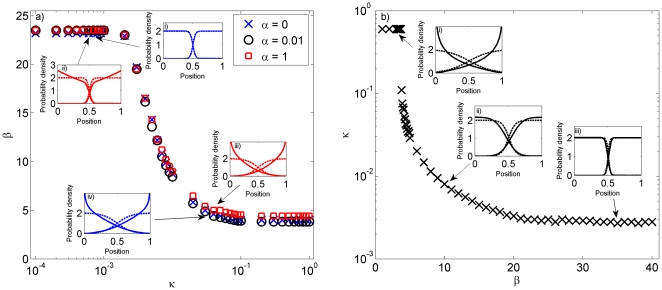
Figure 5. Comparison with a previous model of territory formation.
The parameter  from the reaction-diffusion model introduced in [9] (see also main text) is compared with the parameters
  and
and  from the 1D analytic model introduced here. Panel (a) shows the
  -value that gives the best-fit animal marginal distribution curve for each given value of
  and
and  . The insets compare the probability distributions for particular values of
  and
and  , where the solid lines represent our model and the dashed lines the reaction-diffusion model. The values used are (i)
  ,
,  , (ii)
  ,
,  , (iii)
  ,
,  , (iv)
  ,
,  . Panel (b) shows the best fit
  -value for a given
  . The
. The  -values used for the insets are (i)
  , (ii)
  , (iii)
  . Low values of
  always give a better fit to a given marginal distribution from the reaction-diffusion model than higher values and do not affect the value of
  that gives the best fit. Therefore we set
  when performing the fitting for panel (b). Low values of
  and
and  together with high values of
  tend to give rise to good fits, but outside this range the two models show quite different results.

