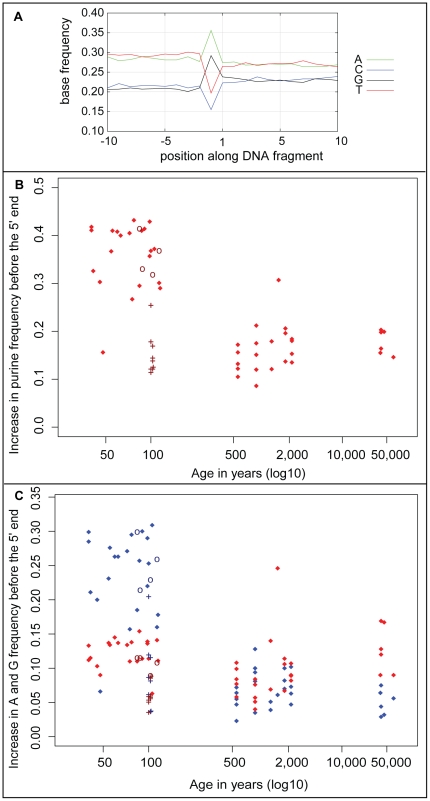
Figure 3. Characteristics of purine frequency prior to strand breaks.
A: Base frequencies 5′ and 3′ of 5′-ends of endogenous mtDNA fragments of a horse (sample 54). B: Increase in purine frequency at position immediately 5′ (position −1) of mtDNA fragment ends relative to positions −5 to −10 as a function of age. Nine samples known to have been “roasted” over fire and treated with ponal glue are indicated by crosses and four samples treated by the “Leipzig cocktail” are indicated by circles. C: Increase in A (blue) and G (red) frequencies at position −1 of mtDNA fragment. Nine samples known to have been “roasted” over fire and treated with ponal glue are indicated by crosses and four samples treated by the “Leipzig cocktail” are indicated by circles.

