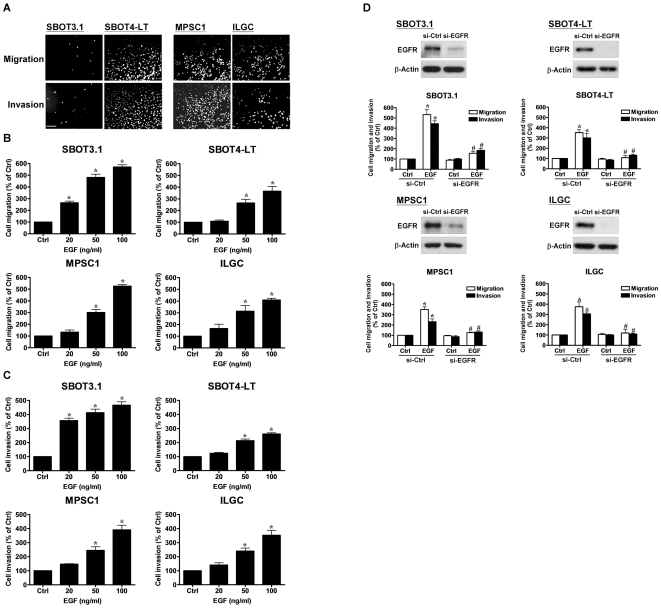
Figure 2. EGF induces cell migration and invasion in SBOT3.1, SBOT4-LT, MPSC1 and ILGC cells.
A, The intrinsic migration and invasion of cells. B and C, Cells were treated with increasing doses of EGF (20, 50 and 100 ng/ml). D, Cells were transfected with control siRNA (si-Ctrl) or EGFR siRNA (si-EGFR) for 48 hr and then treated with 50 ng/ml EGF. After treatment cells were seeded into un-coated (migration) and Matrigel-coated (invasion) transwell inserts. After 24 hr (migration) and 48 hr (invasion) incubation, non-invading cells were wiped from the upper side of the filter and the nuclei of invading cells were stained with Hoechst 33258. Top panels show representative photos of the migration or invasion assay. Scale bar represents 200 µm. Bottom panels show summarized quantitative results which are expressed as the mean ± SEM of at least three independent experiments. Western blots show the knockdown of EGFR by EGFR siRNA. *p<0.05 compared with Ctrl. #p<0.05 compared with EGF or EGF in si-Ctrl.

