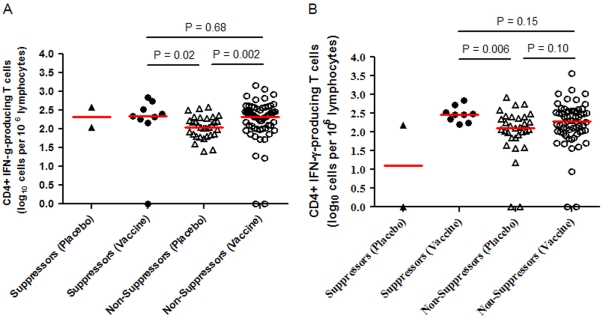
Figure 2. HIV-1 Gag-specific CD4+ IFN-γ-producing T cells at weeks 8 and 38 categorized by initial virologic suppression and treatment arm.
Panel A, CD4+ IFN-γ response 8 weeks after receiving the first vaccine dose. Number of cells quantified by the intracellular cytokine staining assay in response to pooled HIV Gag peptides. Panel B, CD4+ IFN-γ response 38 weeks after receiving the first vaccine dose and immediately prior to initiating the analytic treatment interruption. Statistical comparison not provided for participants in the “Suppressors (Placebo)” group as only two participants fell into this category.

