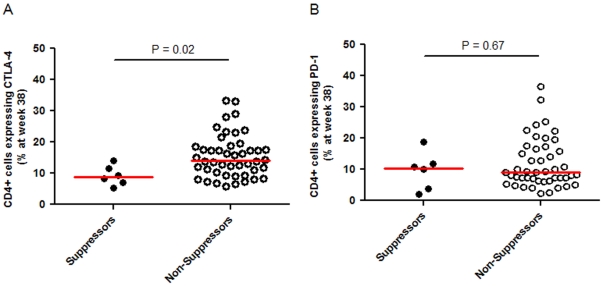
Figure 3. Expression of HIV-1 CD4+ T cells expressing either CTLA-4+ or PD-1+ by participants with and without initial virologic suppression.
Panel A, Percentage of CD4+ T cells expressing CTLA-4 at week 38 detected using flow cytometry. Panel B, Percentage of CD4+ T cells expressing PD-1 at week 38 detected using flow cytometry.

