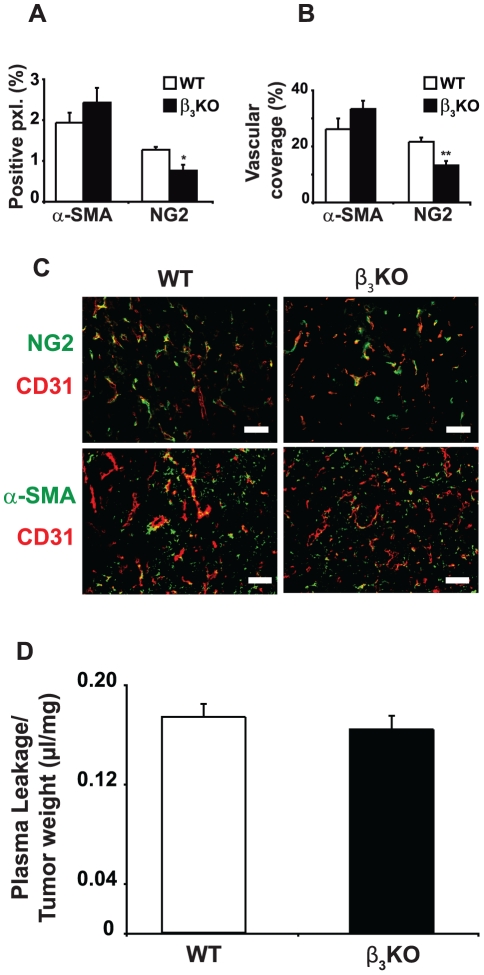
Figure 5. Pericyte coverage in CT26 carcinomas grown in integrin β3-deficient and WT mice.
A) The total fraction of pxl. positive for NG2 or α-SMA were quantitated. B) The amount of CD31 and NG2 double positive pixels (pxl.) and CD31 and α-SMA double positive pixels were quantitated and presented as the fraction of CD31 pixels that were also NG2 or α-SMA positive. C) Representative immunofluorescence images of CD31 double stained with either NG2 or α-SMA in CT26 carcinoma sections from both genotypes (× 200 magnification). D) Leakage of Evans blue dye was assessed in integrin β3-deficient (n = 4) and WT mice (n = 5) bearing CT26 carcinomas. Leakage was corrected for the tumor plasma volume. Data are presented as leaked volume plasma per tumor tissue dry weight. Bar is 50 µm. * indicates p<0.05 and ** indicates p<0.01 by Mann-Whitney test. Error bars are SEM.

