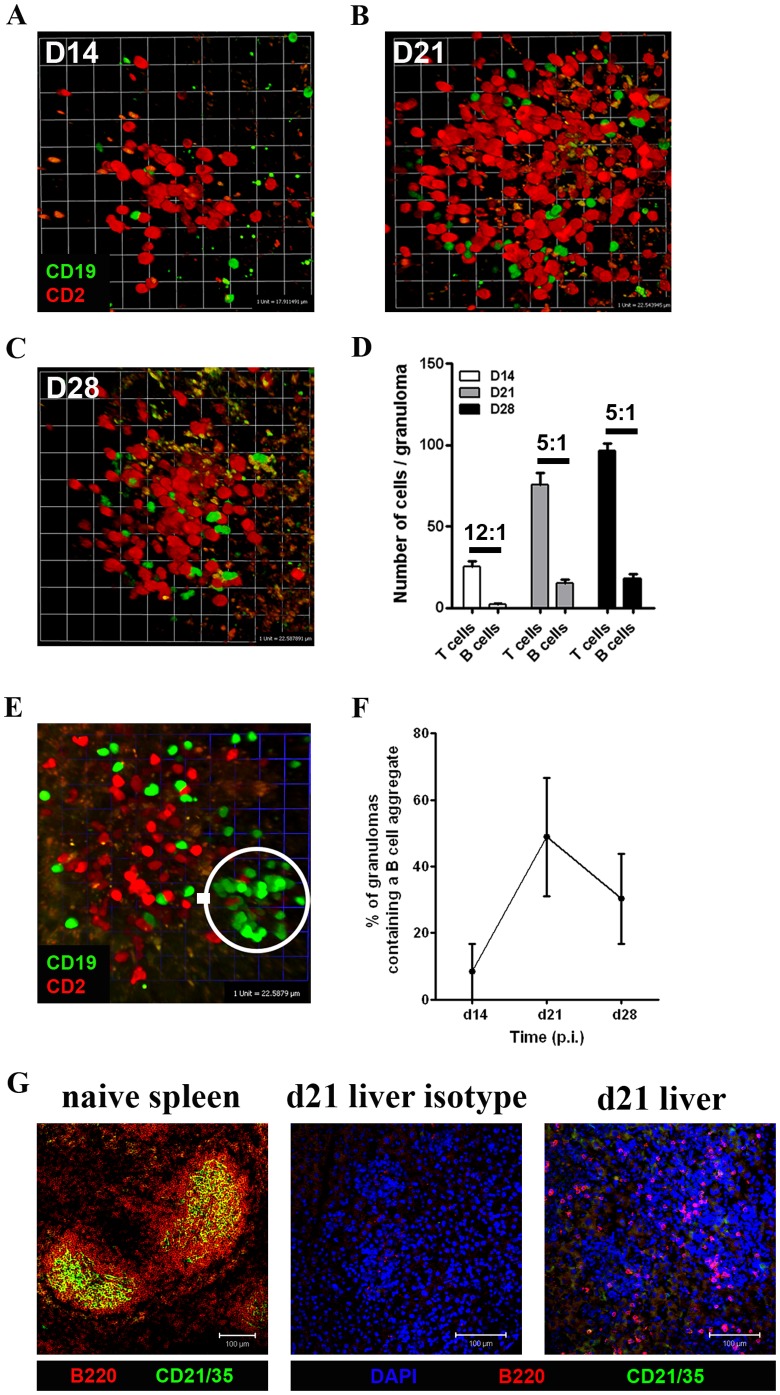
Figure 2. The recruitment of B cells to L. donovani-induced hepatic granulomas.
Bgreen/Tred mice (n = 6) were infected with L. donovani and at d14 (A), d21 (B) and d28 (C) p.i. liver explants were imaged using 2-photon microscopy to visualize T cells and B cells. D. Number of T cells and B cells at d14 (open bars) d21 (grey bars) and d28 (black bars) p.i. derived from 25–35 hepatic granulomas per time point from 2 mice per group. Data are shown as mean ± SEM along with the T cell: B cell ratio. E. B cells aggregate in hepatic granuloma. F. The number of B cell aggregates per granuloma was determined from 25–35 granulomas (mean ± SEM). G. C57BL/6 mice were infected with L. donovani (n = 3). Frozen sections were labeled with B220 (red), CD21/35 (green) and counterstained with DAPI (blue, except left panel). 60 hepatic granulomas were imaged. Control staining of spleen was performed (left panel).

