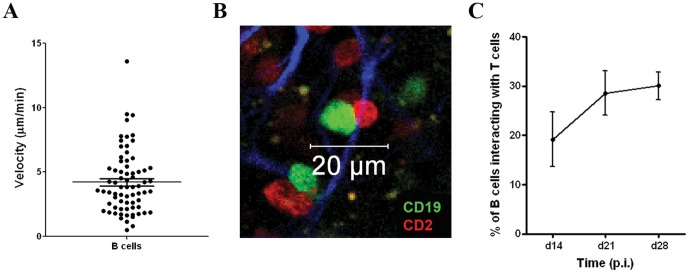
Figure 6. Endogenous B cell behavior in hepatic granulomas.
A. B cell velocity in granulomas of d21-infected Bgreen/Tred mice. Each symbol represents an individual B cell. Bar shows median velocity calculated from 71 B cells in 12 granulomas imaged in two mice. Liver explants tissue from Bgreen/Tred mice was imaged using 2-photon microscopy and B cell-T cell contacts (B) identified by static imaging. The second harmonic signal is also visible (blue). Data represents the mean ± SEM % B cells interacting with T cells (C) and were derived from 25 and 35 granulomas from 2 mice per time point.

