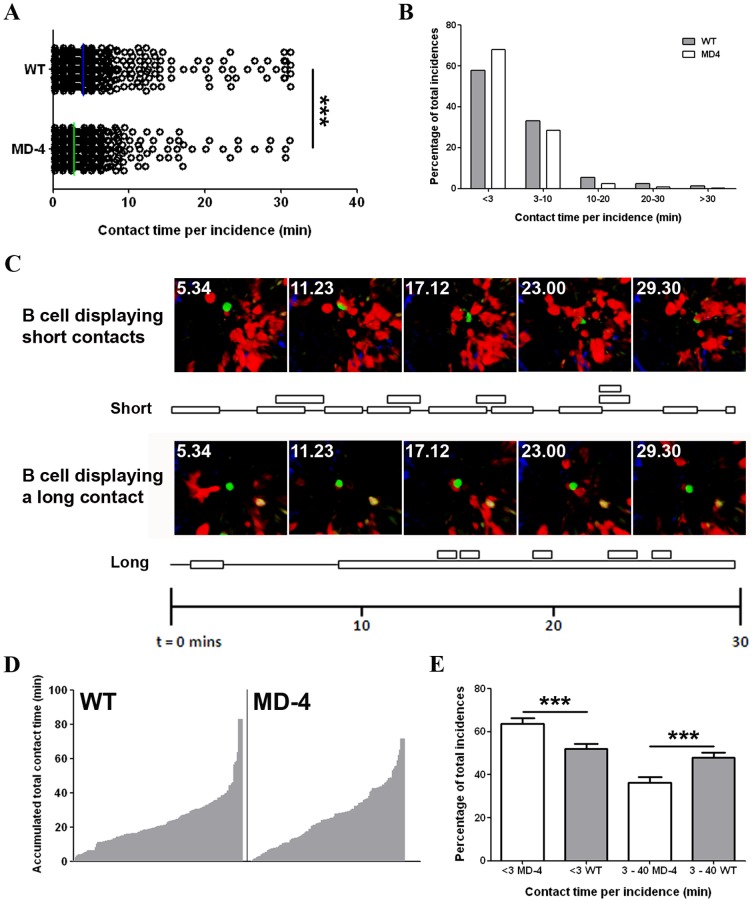
Figure 9. B cells in granulomas make contacts with endogenous T cells.
A. MD-4 and immune B cells were evaluated for contacts with DsRed+ cells in 28 granulomas imaged from two L. donovani-infected Tred mice. The duration of all individual contacts is shown as a separate symbol. B. The frequency of contacts of different duration is shown for MD-4 (open bars) and immune (grey bars) B cells; P<0.001). C. Single frames from Video S1 showing two immune B cells making short (top images) or long (bottom images) contacts with DsRed+ cells. Contact plot is shown below, where each box represents a contact period and adjacent boxes indicate where multiple DsRed+ cells are bound simultaneously. D. The total time each individual B cell (grey bars) spends interacting with any granuloma T cell during the imaging period (i.e. the accumulated total contact time) is shown. Note that due to interactions with multiple T cells, some B cells show an accumulated total contact time longer than the imaging time of 30 min. E. Distribution of contact times for each individual MD-4 (open bars) or immune (grey bars) B cell. Data are expressed as frequency of total incidences for each B cell that involved short (<3 min) or long (>3 min) contact with an endogenous DsRed+ cell. **, p<0.01.

