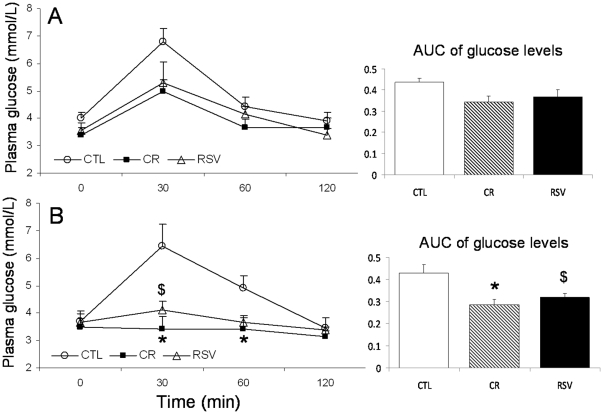
Figure 2. Plasma glucose concentrations and area under curves (AUC) during oral glucose tolerance test in control (CTL), calorie restricted (CR) and resveratrol supplemented (RSV) animals.
A: after 21 months of treatment and B: after 33 months of treatment. Data are expressed as means±SEM. Statistical significance (*) p<0.05 when comparing CTL and CR animals, ($) p<0.05 when comparing CTL and RSV animals.

