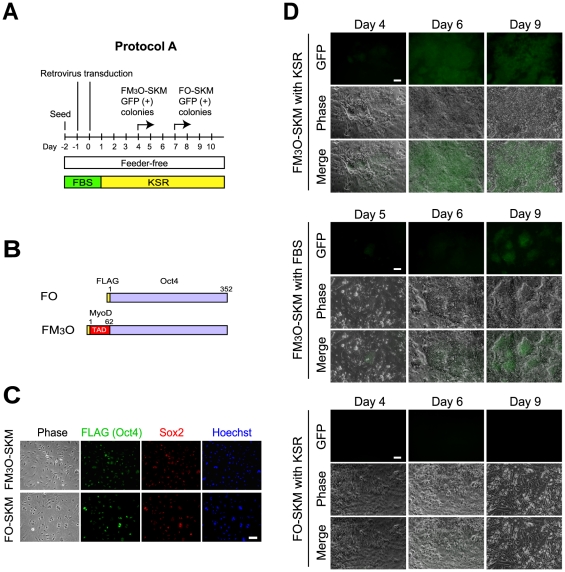
Figure 1. Formation of mouse iPSCs with FM3O-SKM and FO-SKM without subculture.
(A) Schematic drawing of Protocol A. (B) Schematic drawings of FLAG-tagged Oct4 and FLAG-tagged M3O. Numbers indicate amino acid positions of Oct4 and MyoD. (C) Immunofluorescence staining of transduced FM3O, FO and Sox2. MEFs were double-immunofluorescence stained with anti-FLAG antibody, which recognized FM3O and FO, and anti-Sox2 antibody on day 2. DNA was counterstained with Hoechst 33342. Bar, 100 µm. (D) Appearance and increase of GFP-positive colonies after transduction with FM3O-SKM and FO-SKM into MEFs. While iPSC medium containing KSR was used in the top and bottom sets, KSR was replaced with 15% FBS in the middle set. Large GFP-positive colonies had fused as early as day 6 with FM3O-SKM and KSR as shown in the top set; however, GFP-positive areas generally diminished by day 9 when these tightly packed cells were left without subculture. Although less than 10 GFP-positive colonies appeared by day 9 with FO-SKM and KSR in a well of a 12-well plate, the majority of the areas did not contain GFP-positive colonies as shown in the bottom set. Bar, 100 µm.

