Figure 5 .
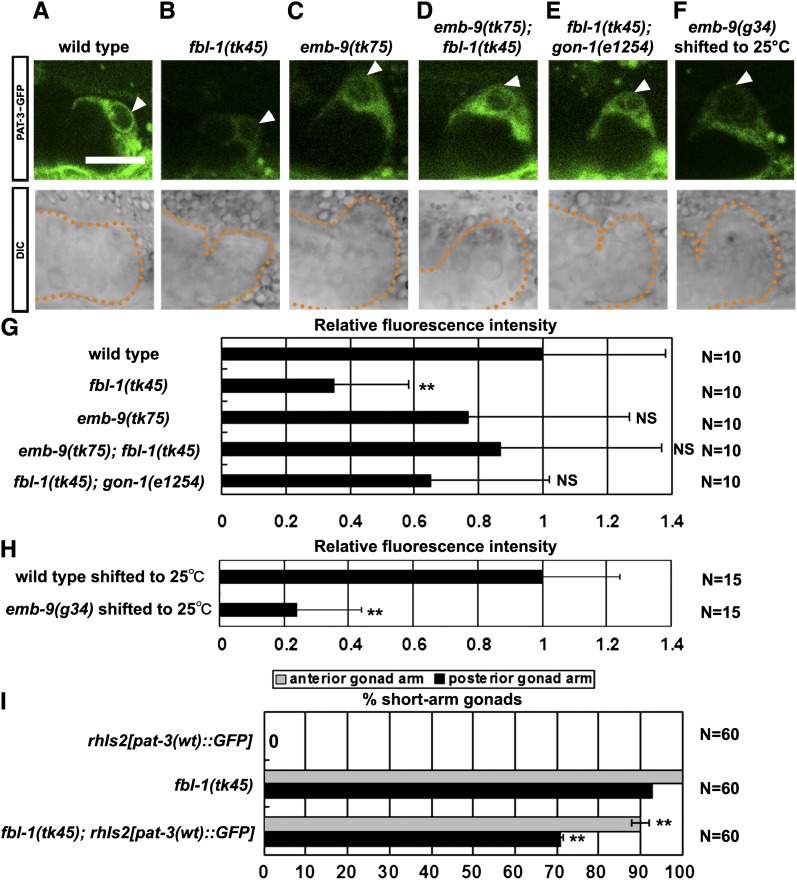
PAT-3–GFP localization in DTCs. Confocal (upper) and Nomarski (lower) images of wild-type (A), fbl-1(tk45) (B), emb-9(tk75) (C), emb-9(tk75); fbl-1(tk45) (D), fbl-1(tk45); gon-1(e1254) (E), and emb-9(g34) (F) L3 hermaphrodites that expressed PAT-3–GFP. (F) emb-9(g34) mutants grown at 16° were shifted to 25° at the L2 larval stage. The arrowhead indicates PAT-3–GFP expression in DTCs. Scale bar, 20 µm. (G) Fluorescence intensity of PAT-3–GFP. All strains contained rhIs2[pat-3(wt)::GFP] in their background. The fluorescence intensity for each sample was normalized to that of the wild type. Ten confocal images of DTCs for each strain were used for quantification. The fluorescence intensity of a rectangular region (2.4 µm × 1.2 µm) at the tip of each DTC was quantified using the ImageJ program (National Institutes of Health), and values were averaged. Data are shown as the mean ± SD. Results for the Student’s t-test vs. the wild-type value are indicated; **P < 0.01; NS, not significant. All images were captured under the same conditions. (H) Fluorescence intensity of PAT-3–GFP in animals shifted to 25°. Fifteen animals for each strain were analyzed. The relative fluorescence intensity was determined as in G. (I) Effect of PAT-3–GFP overexpression in fbl-1(tk45) mutants as analyzed by quantification of gonadal elongation defects. Data are shown as the mean ± SD. Results for Fisher’s exact test vs. fbl-1(tk45) are indicated; **P < 0.01.

