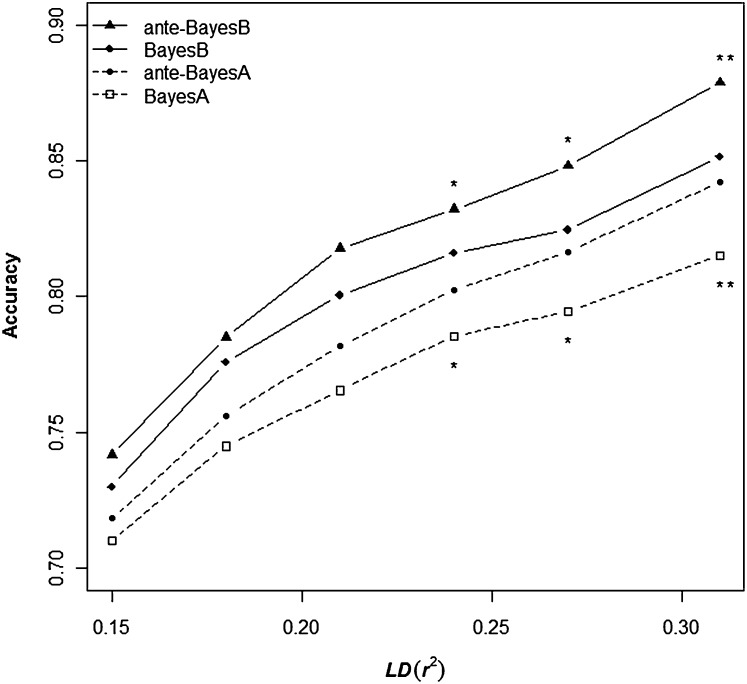
Figure 4 .
Average accuracies of estimated breeding value across 20 replicates for analyses based on each of six LD levels. Differences in accuracy between BayesA and ante-BayesA (circle and square) and between BayesB with ante-BayesB (triangle and diamond) indicated as significant by (*) P < 0.01 or (**) P < 0.001.

