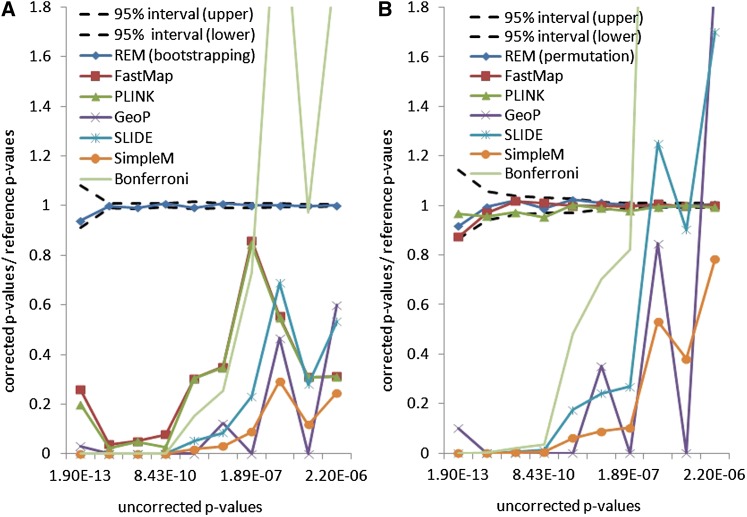
Figure 2.
Accuracy evaluation of selected methods on real gene expression traits in an inbred mouse data set. (Each line represents the ratio between the corrected P-values and the reference P-values for a method. The reference P-values are obtained using 100 million resamplings. An accurate method should yield a ratio of 1. In A, the reference P-values are estimated by a weighted bootstrap method. In B, the reference P-values are estimated by a permutation test.)

