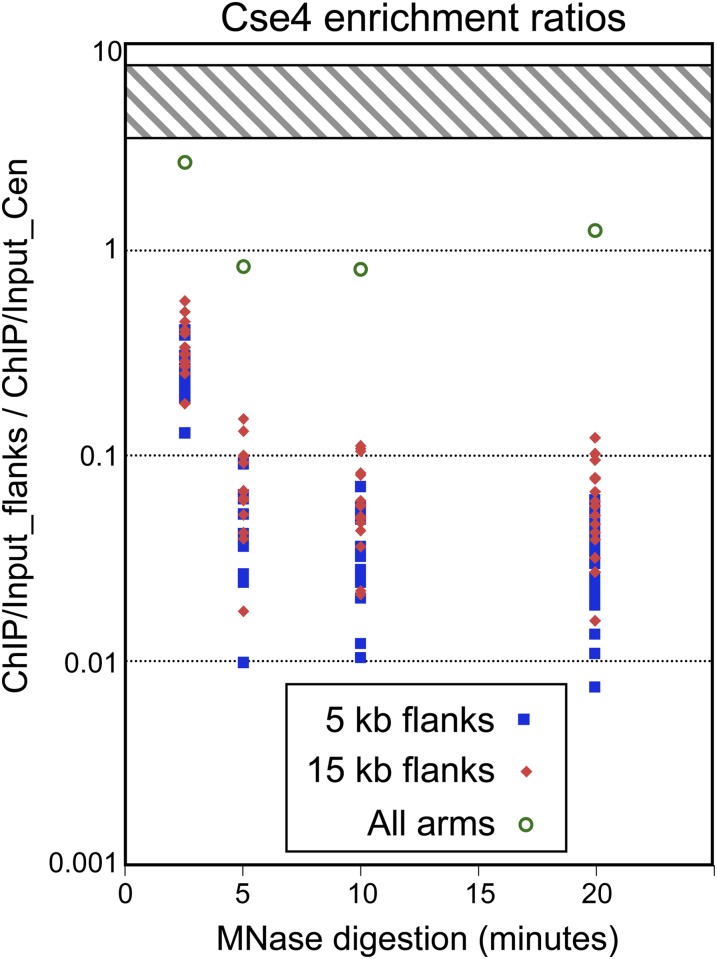
Figure 2.
Low occupancy of Cse4 over centromere-flanking regions. For each centromere, Cse4 enrichment is the ChIP/input normalized count ratio summed over each base pair in the CDE. For each centromere flank, Cse4 enrichment is the ChIP/input ratio summed over each base pair, excluding the 200-bp interval centered over the mid-CDE (between the dotted lines in Figure 1). Flank/centromere ratios are shown for individual chromosomes, and include both flanks out to 5 kb (blue squares) or 15 kb (red diamonds). The ratio for all chromosome arms (green open circles) was obtained by dividing the total Cse4 ChIP/input ratio in the sample, excluding the CDE ±100 bp, by that for all 16 CDEs. A ratio of 1 implies that there is cumulative enrichment in both flanks that is equal to that in the CDE. The hatched region represents the predicted range of the ratio based on fluorescence (4–8 for Coffman et al. (2011) and 3.5–6 for Lawrimore et al. (2011).

