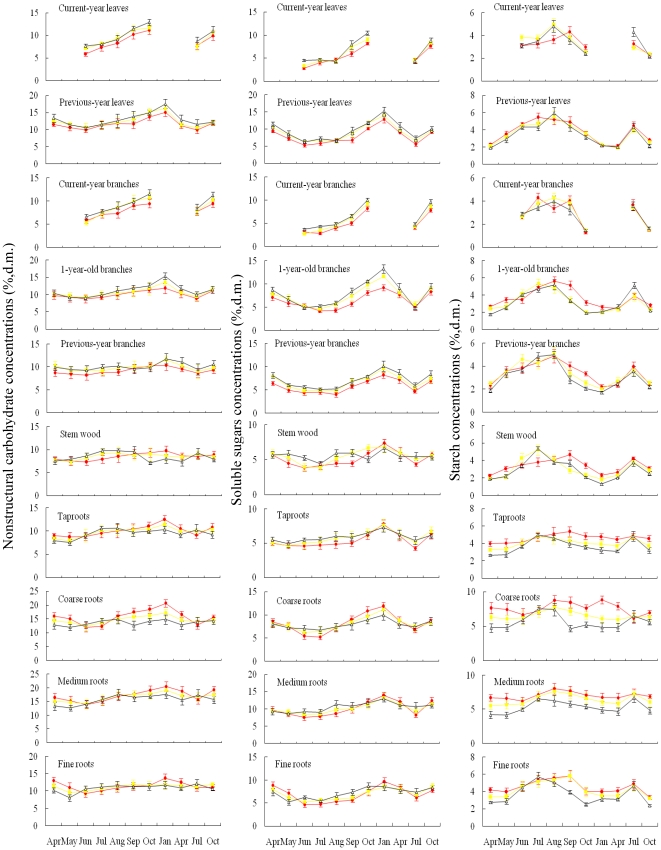
Figure 1. Mean concentrations (±1SE, n = 6, % d.m.) of nonstructural carbohydrates (left panels), soluble sugars (middle panels), and starch (right panels) in relation to sampling time for tissues of Quercus aquifoliodes shrubs grown at 3000 m, 3500 m, and 3950 m a.s.l. on the Mt. Zheduo, SW China.
Symbols: • (red) = 3000 m a.s.l.; ▪ (yellow) = 3500 m a.s.l.; Δ (black) = 3950 m a.s.l.

