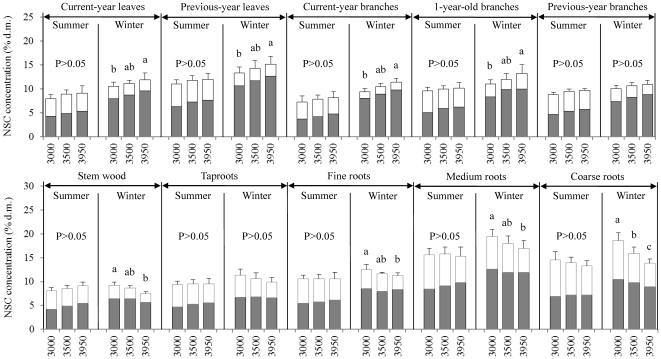
Figure 2. Mean concentrations of soluble sugars (dark gray), starch (white), and non-structural carbohydrates (NSC = soluble sugars+starch) in tissues of Quercus aquifolioides grown at 3000 m, 3500 m, and 3950 m a.s.l. during the growing season (May–September) and the dormant season (October–April), calculated using data measured across an one-year cycle from May 2008 to April 2009.
Statistical differences in means among elevations within each tissue category and season were tested by t-paired comparison. Different letters indicate statistically significant differences (p<0.05) in NSC among elevations. Standard error bars (+1SE) are given for NSC only.

