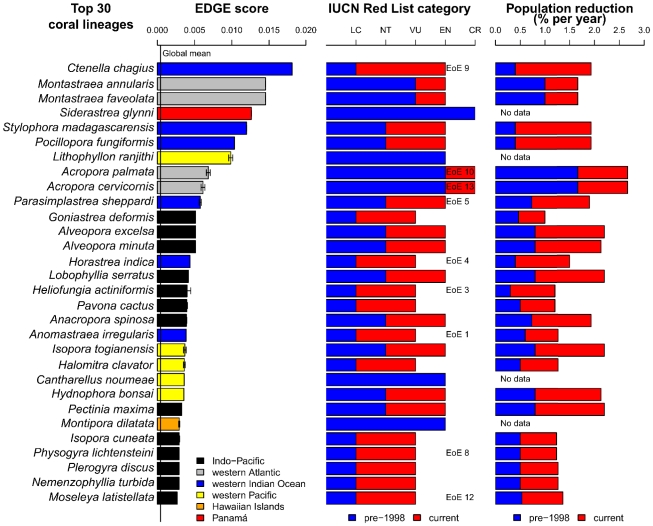
Figure 4. Top 30 reef corals ranked according to EDGE scores.
List of corals representing high evolutionary distinctiveness and extinction risk. Left panel shows the EDGE score for each species. Global mean score for all 837 reef corals denoted by vertical line through bars, which are coloured to indicate respective geographic ranges. Error bars represent standard deviation. Middle panel shows pre-1998 and present IUCN Red List categories, as well as ranks according to the EDGE of Existence (EoE) programme. Right panel shows pre-1998 and present rates of global population reduction. IUCN Red List and population reduction data derived from Carpenter et al. [11].

