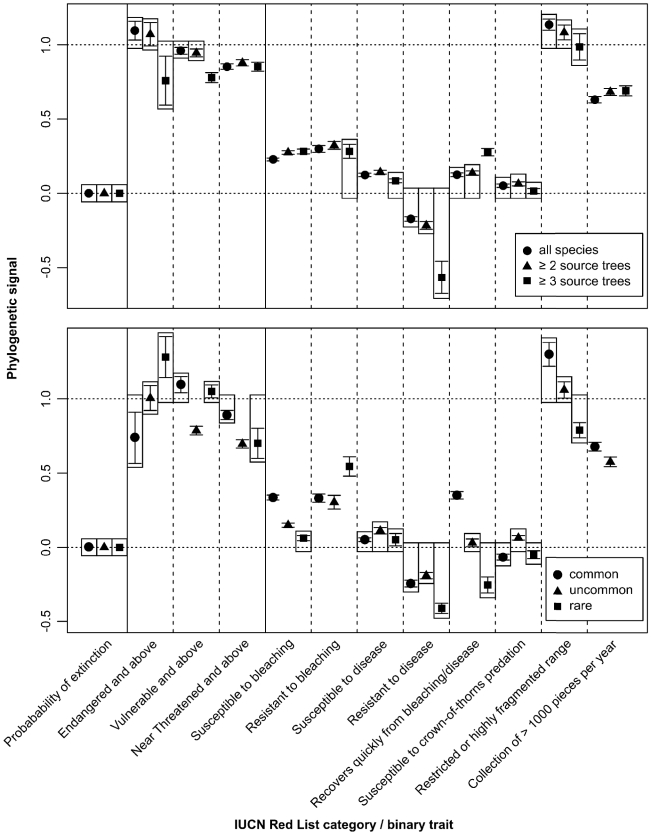
Figure 6. Species' source tree representation and abundances show limited effect on phylogenetic signal strength.
Measure of phylogenetic signal based on K for probability of extinction (K = 0 for random continuous traits) and D for all other traits (D = 0 for clumped and D = 1 for random binary traits). Upper and lower panels show levels of phylogenetic signal for datasets with varying degrees of source tree representation and abundance respectively. Error bars represent standard deviation. Means not significantly different from zero or one are enclosed by boxes with those values.

