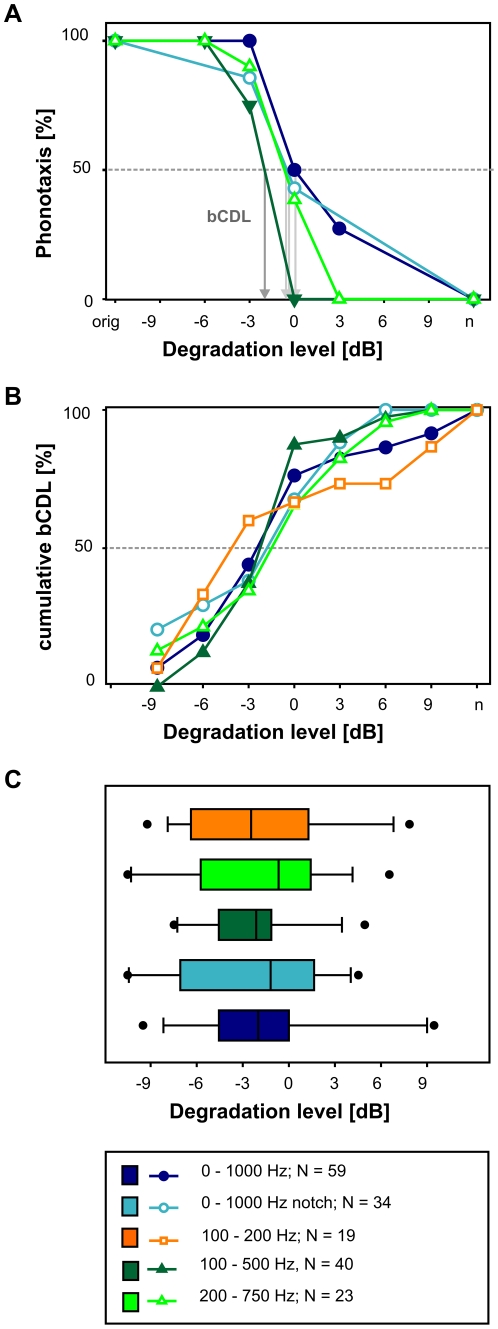
Figure 2. The influence of different envelope maskers on signal recognition.
A) Turning response of one male tested with four different degradation bands. The abscissa shows the degradation levels in dB, ‘orig’ indicates the original song; ‘n’ indicates pure noise. The ordinate shows the percentage of turning responses. For each phonotaxis curve a behavioural critical degradation level (bCDL) was interpolated at the intersection of each phonotaxis-curve with the 50% response level. B) Cumulative percentage of bCDLs for five different bands of envelope degradation. The ordinate shows the cumulative bCDLs [in %] as a function of signal degradation (abscissa). C) The distribution of bCDLs for five of six frequency bands tested. Boxes cover the interquartile ranges, whiskers the range from the 10th to the 90th percentile. Points indicate the outliers The medians bCDLs of these bands were between-3 dB and 0 dB. 0–1000 Hz: median = −2 dB, N = 59; 0–1000 Hz notch: median = −1.2 dB N = 34, 100–500 Hz: median = −2.1 dB, N = 40, 200–750 Hz: median = −0.7 dB, N = 23; 100–200 Hz: median = −2.5 dB, N = 19.

