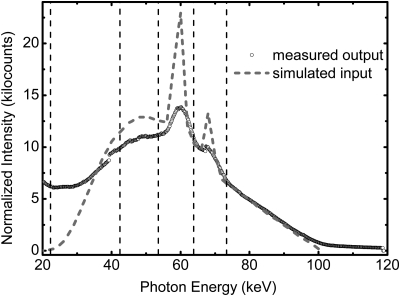
Figure 4.
The recorded spectrum of the CZT detector and the simulated incident spectrum at tube voltage of 100 kVp and tube current of 1.0 mA. The spectra were normalized with respect to the integrated energy. Significant distortions can be observed in the measured spectrum due to multiple artifacts. The energy thresholds are noted by dashed lines for five energy bins.

