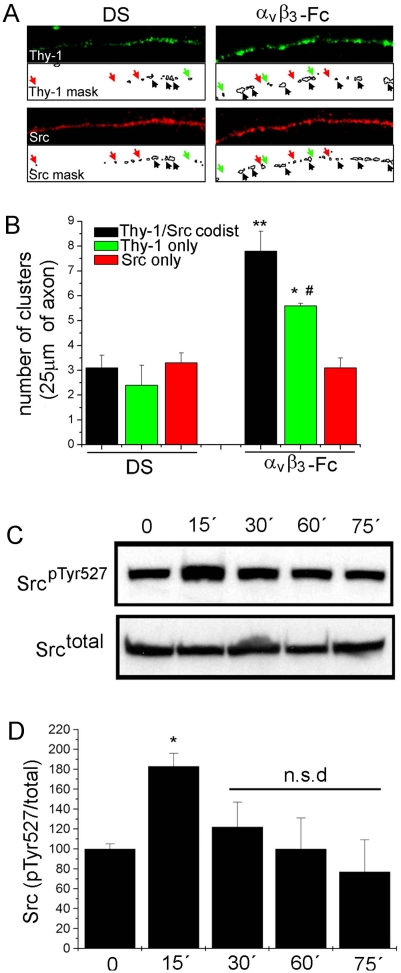
Figure 8. αVβ3-Fc induces Thy-1/Src co-distribution and Src inhibition in cortical neurons.
Mature cortical neurons were treated with supernatants containing αVβ3-Fc fusion protein (αVβ3-Fc) or with αVβ3-Fc-depleted supernatants (DS) for 15–75 minutes. (A) After 15 minutes, neurons were fixed and immunostained for Thy-1 (green) or total Src kinase (red). Samples were photographed using a conventional fluorescence microscope. Clusters were identified creating a 1-bit mask for each fluorescent channel using Image J software. Black arrows indicate Thy-1 clusters co-distributed with Src clusters. Green arrows indicate Thy-1-only, red arrows Src-only clusters. (B) Quantification of cluster distribution as indicated. **P<0.01, *P<0.05 compared with number of Thy-1/Src co-distributed clusters in DS. #P<0.05 compared to Thy-1/Src co-distributed clusters in αVβ3-Fc. Results averaged from three independent experiments analyzing 5 axonal segments per experiment are shown. (C) At different time points, neurons were lyzed and analyzed by Western blotting. Blots for Src phosphorylated at tyrosine 527 (SrcpTyr527) and total Src (Srctotal) are shown. (D) Numerical values were obtained by scanning densitometry from three independent experiments and are expressed as phosphorylated/total Src ratio for each time point. *P<0.05 compared to time = 0. n.s.d. indicates non-significant differences compared to time = 0.

