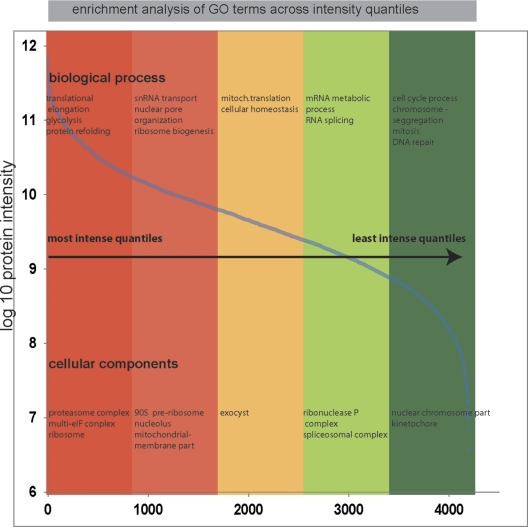
Fig. 3.
Dynamic range of the identified proteome. Expression levels of identified proteins were roughly estimated using their summed peptide intensities. The proteins were ranked into five quantiles based on their abundance. A Fisher exact test extracted enriched GO terms in each quantile (false discovery rate < 0.02 after Benjamini-Hochberg correction).

