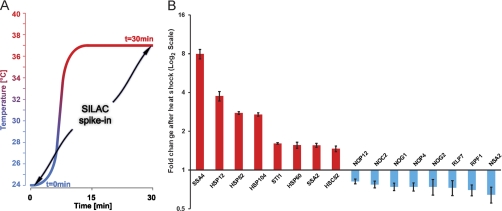
Fig. 5.
Quantitation of heat shock response by spike in SILAC strategy. A, schematic representation of the heat shock experiment. Samples at t = 0 and 30 min after incubation at 37 °C were mixed 1:1 with spike-in SILAC standard grown at 30 °C. B, fold change represented in log2 ratios is shown for selected proteins.

