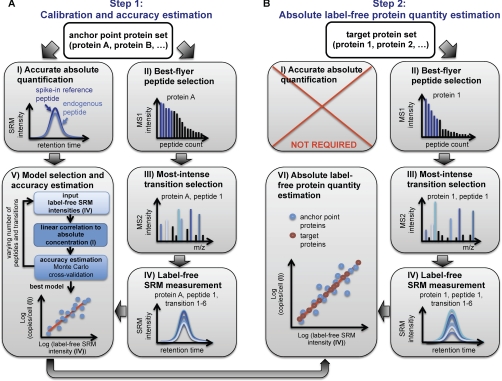
Fig. 1.
Schematic workflow of absolute label-free protein abundance estimation using SRM. The method comprises a two-step procedure. A, in the first step, a calibration curve is generated based on a defined number of anchor point proteins. For this, protein intensity values derived from label-free SRM measurements of best flyer peptides are correlated to independently determined absolute protein concentrations using the SID methodology. In this step, the accuracy of the method can be estimated, and the best model of peptide and transition combinations can be identified. B, in the second step, absolute protein abundances of a user-defined number of target proteins can be estimated by monitoring also for those proteins best flyer peptides and by applying the model and calibration curve derived from step 1. To ensure optimal comparability in MS signal responses between anchor point and target proteins, ideally both data sets should be measured simultaneously.

