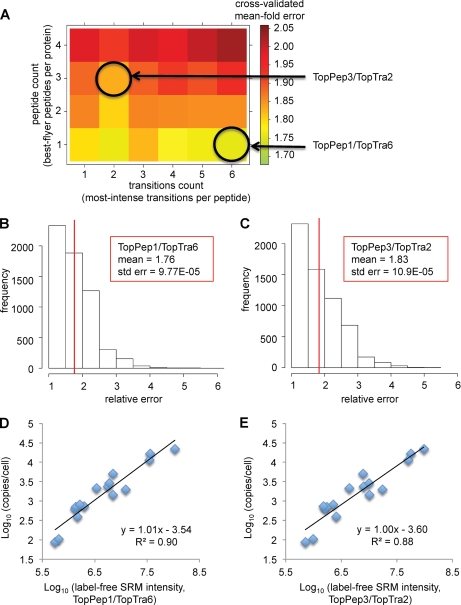
Fig. 3.
Model selection and accuracy estimation using Monte Carlo cross-validation. A, heat map visualization of the predictive measurement accuracy, represented by the cross-validated mean fold error, applying different models based on varying peptide and transition counts. Each square represents one particular linear model, which considers a specific number of summed best flyer peptides and most intense transitions, as annotated by the axes. Ranking of peptides and transitions was performed based on decreasing signal intensity. B and C, prediction error histograms for the linear models considering either the single best flying peptide per protein (TopPep1/TopTra6) or the summed intensity of the three best flying peptides (TopPep3/TopTra2). D and E, linear regression curves for the two models TopPep1/TopTra6 and TopPep3/TopTra2, respectively.

