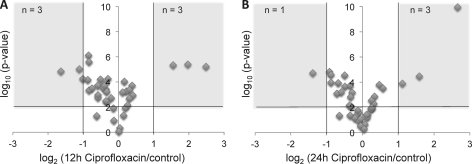
Fig. 5.
Identification of significant protein abundance changes between control and antibiotic-treated samples. Logarithmic protein changes (log2) of the 12 h of ciprofloxacin treatment (A) and 24 h of ciprofloxacin treatment (B) relative to the control condition were correlated to their respective logarithmic (log10) p values, calculated by a t test analysis. Threshold settings of protein changes >2-fold and p values < 0.01 (black lines) were applied to identify significantly regulated proteins.

