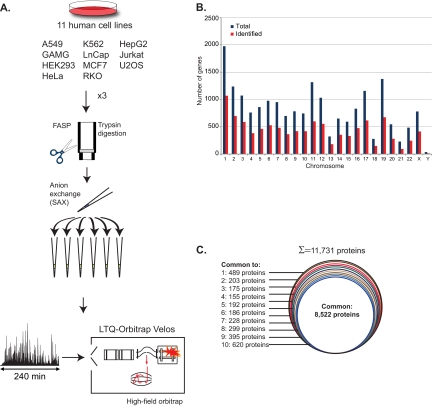
Fig. 1.
Deep proteome analysis of eleven cell lines. A, Eleven commonly used human cell lines were cultured, lysed in SDS based buffer, trypsin digested according to the FASP protocol, and separated into six fractions using SAX in a StageTip format. The analysis was performed in triplicate (1-day measurement per proteome each). LC MS/MS with 4-h runs and HCD fragmentation were performed in the LTQ-Orbitrap Velos equipped with a high field Orbitrap analyzer. B, Distribution of the identified genes (red) in relation to total genes (blue) for each chromosome. Slightly more than half the genome was covered in total and in each chromosome. C, Proportion of proteins identified in all or various subsets of cell lines.

