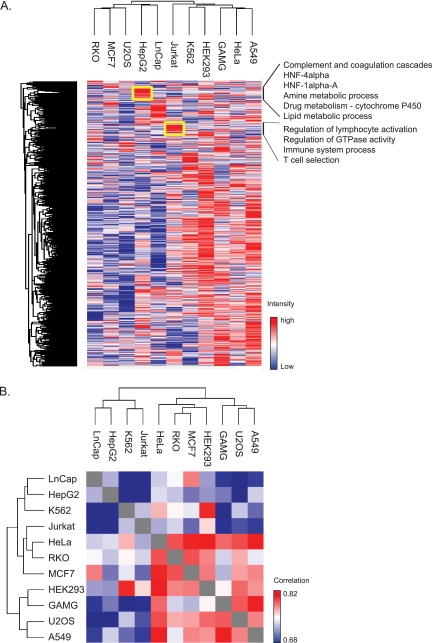
Fig. 3.
Hierarchical clustering based on label-free proteome quantification. A, Two-way unsupervised hierarchical clustering of the median protein expression values of all proteins in a cell line does not group the cell lines according to the tissue of origin. This indicates dedifferentiation compared with the in vivo cell type. However, clusters of coregulated proteins carrying out cell type specific functions are retained (see yellow boxes for examples). Listed functions have FDR values (greatly) below 0.02 by Fishers exact test. B, Matrix representation of Pearson correlation values of the label-free protein abundances of each cell line proteome against the others. Correlations are uniformly high, varying only between r = 0.68 and 0.83.

