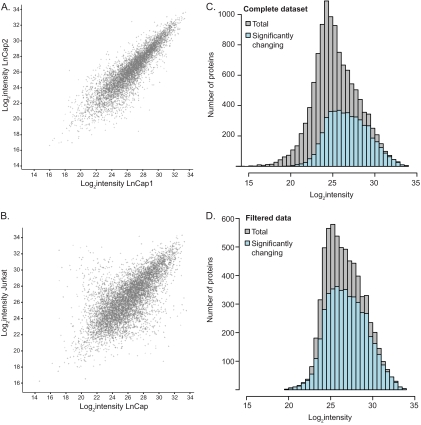
Fig. 4.
Significance of proteomic changes across the abundance range. A, Scatter plot of label-free protein intensities between the first and second replicate of the prostate cancer cell line LnCap. B, The spread in the scatter plot of the median of triplicates of two different cell lines LnCap and the T-cell leukemia derived Jurkat cells is larger than in A. C, Significantly changing proteins in at least one of the eleven cell lines appear to be more abundant compared with the entire proteome. D, Filtering for robustly quantified proteins (a minimum of 16 valid quantification values) reveals that more than two thirds of the proteome are changing significantly and that this proportion does not depend on protein abundance.

