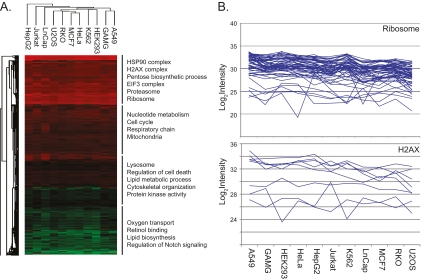
Fig. 5.
Variability of cellular functions in dependence of protein abundance. A, Annotation matrix of protein attributes, such as pathways, complexes and gene ontologies versus the eleven cell lines. Color code indicates the normalized median abundance of the proteins belonging to the category (red most abundant; green least abundant). Protein annotations are separated into four blocks and labeled with representative individual annotations. B, Proteins comprising the “ribosomal” category are highly and uniformly expressed across the cell lines (upper panel). Proteins comprising the category “H2AX” are highly abundant but their expression levels vary dramatically across the cell lines.

