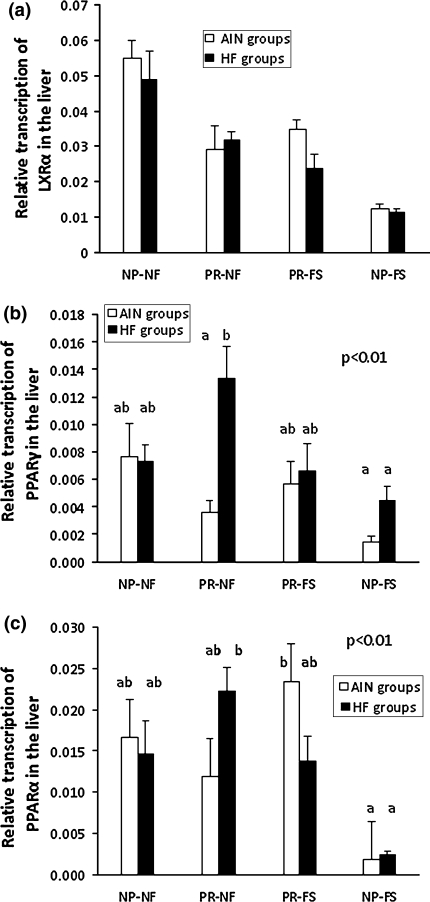
Fig. 4.
Quantification of mRNA levels of LXRα (a), PPARγ (b), and PPARα (c) in the livers of rats belonging to different maternal dietary groups. The results are presented as group means with standard errors. The significant effects of protein content × folic acid and content × fat content are shown in b and c (multi-way ANOVA, P < 0.01 for both associations). Bars with the same superscript are not significantly different from each other (n = 8)

