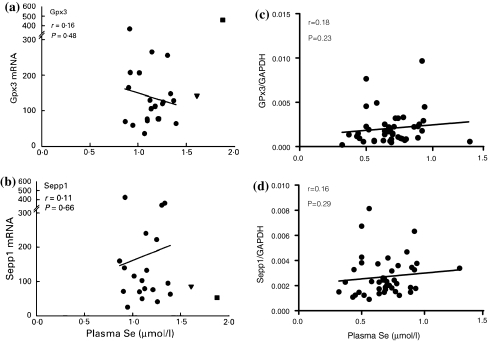
Fig. 1.
Correlation between plasma Se and GPx3 transcripts level in population with adequate—British (whole blood) (Sunde et al. 2008) (a) and suboptimal—Polish (leukocyte) (Reszka et al. 2009) (c) Se level and correlation between plasma Se level and SePP1 transcripts level in population with adequate—British (whole blood) (b) and suboptimal—Polish (leukocyte) (d) Se level a and b reproduced with permission from Sunde et al. (2008)

