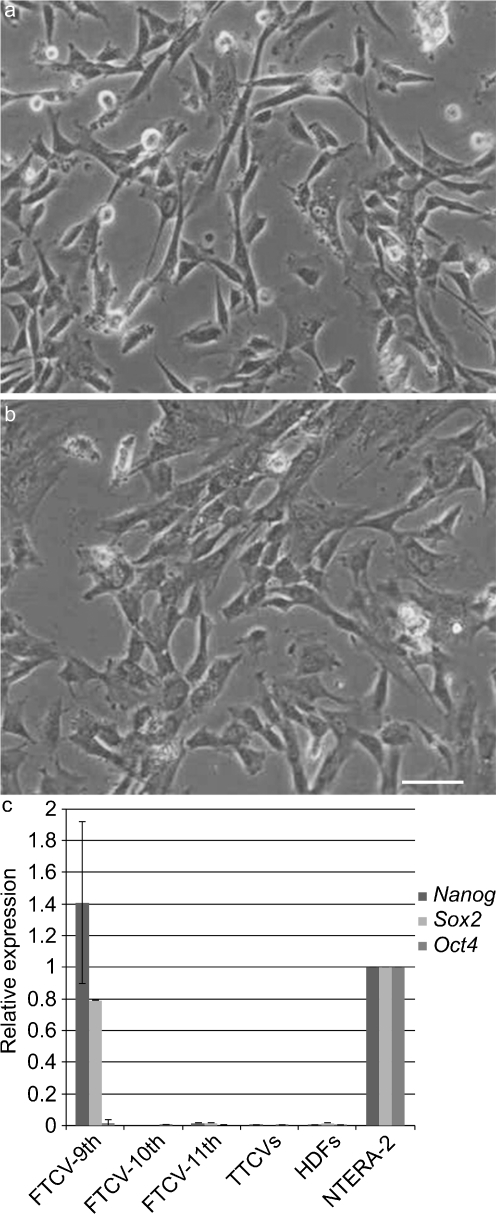
Fig. 1.
Phase contrast microscopic images of undifferentiated first-trimester chorionic-villi-derived cells (FTCVs; a) and third-trimester placental chorionic-villi-derived cells (TTCVs; b). Bar 50 μm. c Quantitative real-time reverse transcription with polymerase chain reaction (qPCR) analysis for Nanog, Sox2 and Oct4 mRNA expression in FTCVs at the 9th (FTCV-9th), 10th (FTCV-10th) and 11th (FTCV-11th) weeks of gestation, TTCVs, normal human dermal fibroblasts (HDFs) and a pluripotent human embryonic carcinoma cell line (NTERA-2). The value for NTERA-2 was set to 1 in each experiment. Each value (n=4) represents the mean ± SD

