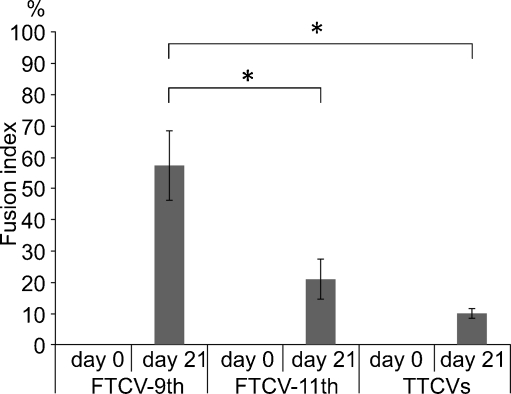
Fig. 7.
Quantification of MF20-positive (MF20+) cells in FTCV-9th cells, FTCV-11th cells and TTCVs during in vitro differentiation. Fusion index was determined by calculating the percentage of nuclei among MF20+ cells, as described. Each data point (n=3) is presented as the mean ± SD. Quantification of MF20+ cells in each population was compared by using the Student’s t-test (*, P < 0.05)

