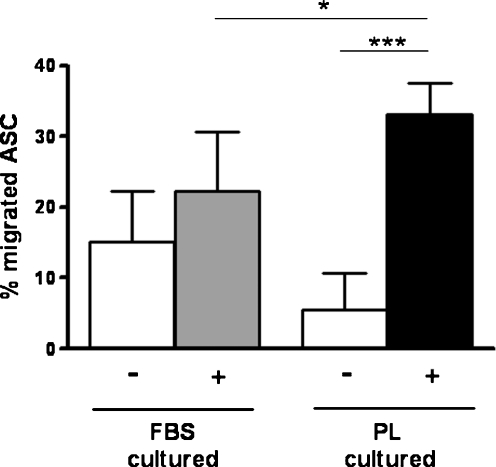
Fig. 4.
PL-cultured ASC have a higher migration rate than FBS-cultured ASC. Migration of FBS- and PL-cultured ASC towards a stimulus (+; combination of 2% FBS and 1% PL) and without a stimulus (−) were compared. Results are shown as percentage migrated ASC of total ASC applied. Bars means ± SD. FBS: n = 7; PL: n = 6; *p < 0.05

