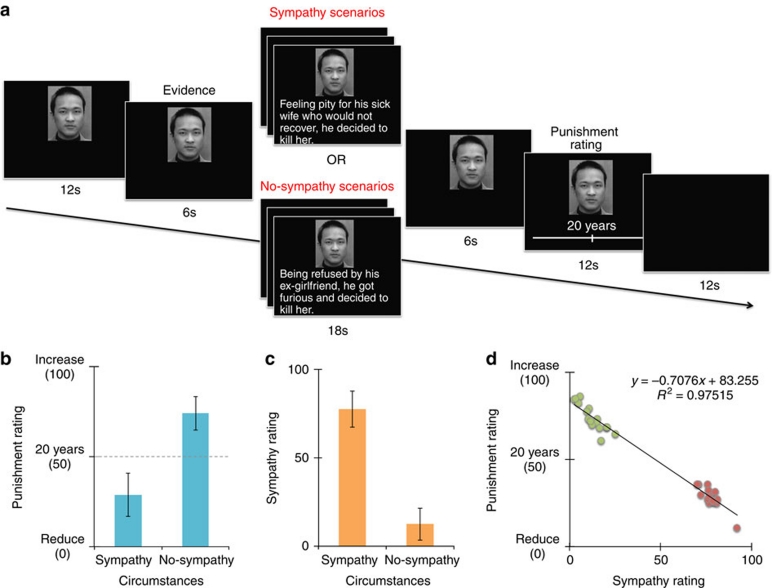
Figure 1. Task design and behavioural performance.
(a) Study paradigm. (b) Mean punishment ratings for sympathy and no-sympathy trials (n = 22, paired t-test, t21=−18.94, P<0.001). (c) Mean sympathy ratings for sympathy and no-sympathy trials (n = 22, paired t-test, t21=11.82, P<0.001). (d) Correlation between sympathy and punishment ratings for sympathy stories (red circles) and no-sympathy stories (green circles). Error bars indicate s.d.

