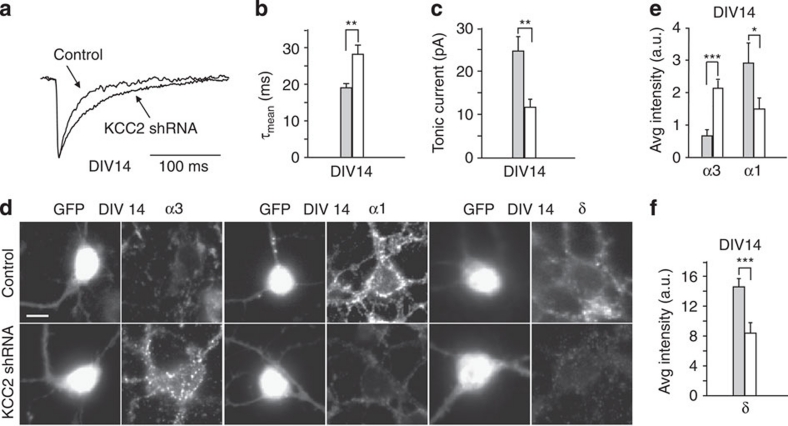
Figure 8. Transfection of KCC2 shRNA at mature developmental stage affects the α3-α1 and δ subunit expression.
(a) Representative sIPSCs traces in control and KCC2 shRNA transfected neurons at DIV14. (b) Summary of sIPSC decay kinetics in control and KCC2 shRNA transfected neurons (control, grey bar n=18; KCC2 shRNA, white bar n=25; **P<0.01; unpaired t-test). (c) Summary of tonic currents in control and KCC2 shRNA transfected neurons (control, grey bar n=10; KCC2 shRNA, white bar n=24; **P<0.01; unpaired t-test). (d) Representative somatic immunostaining of α3, α1 and δ subunits in control and KCC2 shRNA transfected neurons. (e) Quantification of immunofluorescence signals for α3 and α1 subunits (α3 control, grey bar n=16; KCC2 shRNA, white bar n=23; ***P<0.001; unpaired t-test; α1 control, grey bar n=16; KCC2 shRNA, white bar n=12; *P<0.05; unpaired t-test). (f) Quantification of immunofluorescence signals for δ subunit (control, grey bar n=34; KCC2 shRNA, white bar n=16; ***P<0.001; unpaired t-test). Scale bar: 23 μm. Data is presented as mean±s.e.m.

