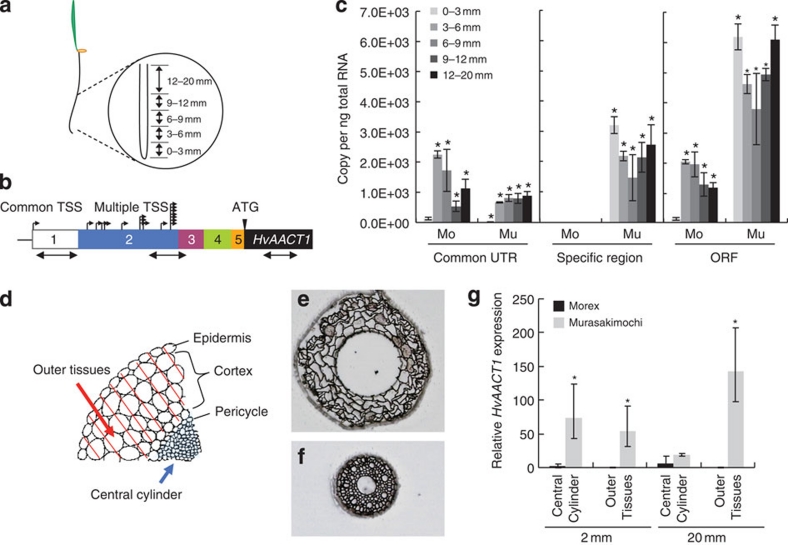
Figure 3. Altered expression patterns of HvAACT1 by a 1-kb upstream insertion.
(a) Schematic presentation of sampling position of roots. (b) Primer location designed for spatial expression analysis. The white and colour boxes showed 5′-UTR sequences of Morex (Mo) and Murasakimochi (Mu). Small black arrows show TSS. Large black arrows show regions for PCR amplification. The number in the boxes shows the position of 5′-UTR. (c) Spatial expression of HvAACT1 in different root zones assayed with different primer sets at the common 5′-UTR, the insertion region and the coding region of HvAACT1, respectively, as shown in b. (d) Schematic presentation of different tissue samples separated by laser microdissection. The epidermis and cortex were collected as outer tissues and inner tissues from pericycle as central cylinder. (e,f) Outer tissues (e) and central cylinder (f) of the roots after laser microdissection. (g) Tissue-specific expression of HvAACT1. Expression level relative to 2 mm central cylinder of Morex is shown. Data in c and g are shown as the mean values±s.d. (n=3). Statistical comparison was performed by one-way ANOVA followed by Dunnett's multiple comparison test. (c) All data were compared with 0–3 mm Morex assayed with the ORF primer. *P<0.05. (g) The expression was compared with the central cylinder of Morex at 20 mm. *P<0.05.

