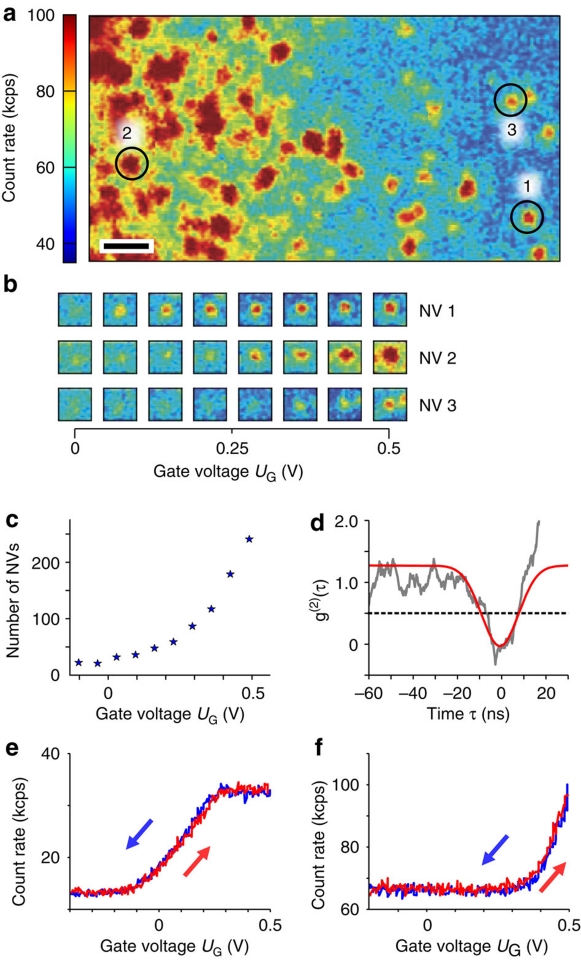
Figure 3. Charge state control of single NV centres.
(a) Fluorescence image of a 5 keV spot in a hydrogenated region at gate potential UG=0.5 V, bar indicates 1 μm. (b) Selected centres at various gate voltages. (c) Number of NV centres visible in the scanned region of (a) at different gate voltages. (d) Photon statistics g(2)(τ) measured on a single centre (background corrected, UG=0.5 V). (e,f) Gate-voltage dependence of the fluorescence intensity of two single NV centres.

