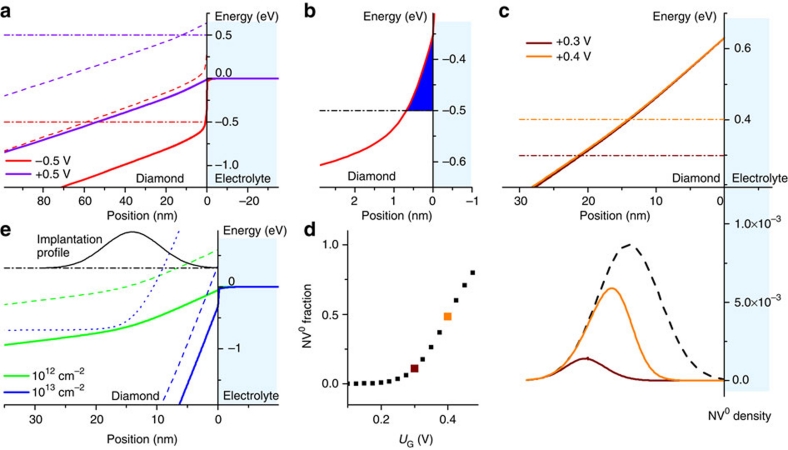
Figure 4. Simulation of the energy band structure of H-terminated diamond in contact with an electrolyte.
(a) At UG=−0.5 V (red), the Fermi level EF (dash-dotted line) crosses the charge transition level NV+/0 (dashed line) much deeper in the diamond as compared with UG=+0.5 V (blue). (b) At negative UG, the Fermi level lies below the VBM (solid line) in the surface region, inducing a two-dimensional hole gas (2-DHG; blue area). (c) Energy band schematic showing the intersection of the Fermi level with the NV+/0 level at UG=0.3 V and UG=0.4 V. The density profile of neutrally charged NV is shown in comparison with the implantation. (d) Simulated fraction of neutrally charged NV versus the gate voltage. (e) VBM and the NV+/0 (dashed lines), as well as the NV0/− charge transition levels (dotted line), are shown for two different implantation dose (1012 and 1013 cm−2). The background nitrogen concentration is 50 p.p.b. The implantation density profile for 10 keV is shown for reference.

