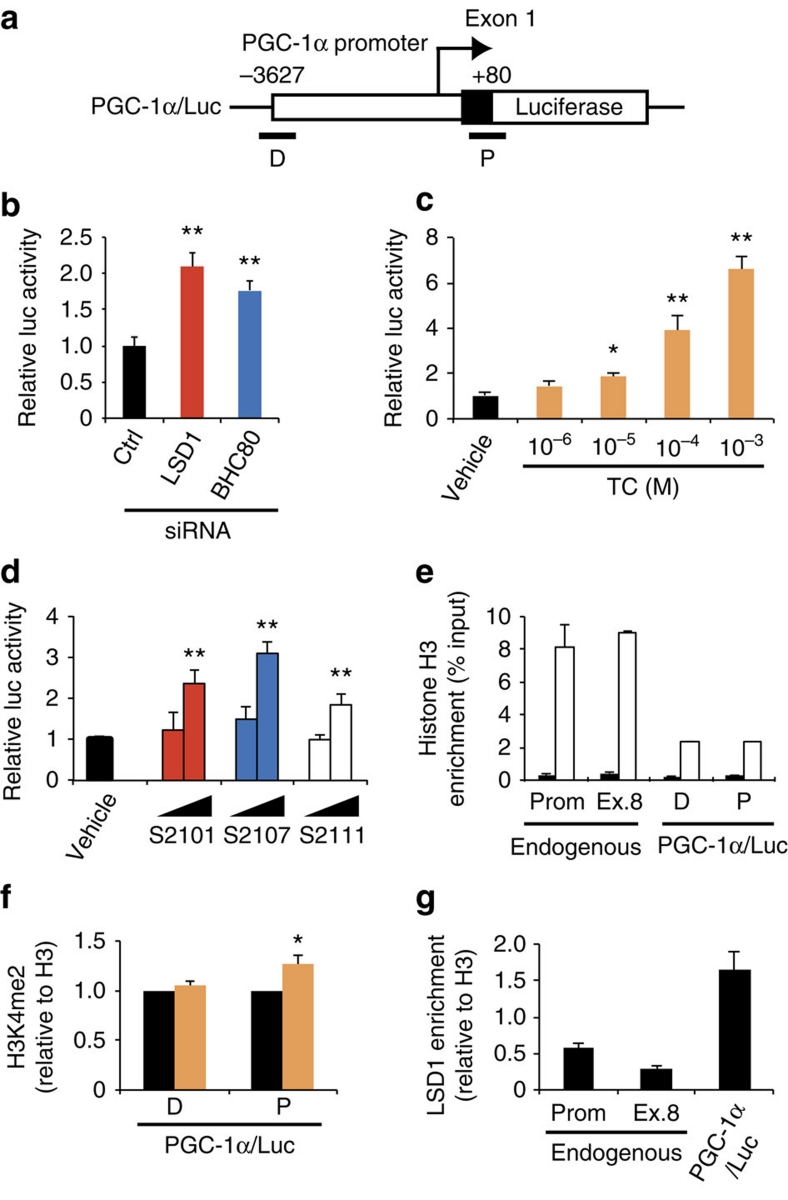
Figure 4. Transcriptional repression of PGC-1α promoter by LSD1.
(a) Diagram of PGC-1α/Luc construct. Sites of ChIP–qPCR primers are indicated as D (distal) and P (proximal). (b) Effects of LSD1-KD and BHC80-KD on PGC-1α promoter activity. After the introduction of indicated siRNAs, 3T3-L1 cells were transfected with a PGC-1α/Luc plasmid and an internal control pRL-TK construct. Luciferase activities were measured at 24 h after the adipogenic induction. (c,d) Effects of LSD1 inhibitors on PGC-1α gene promoter activity. TC (c) was used at the indicated concentrations whereas SLIs (d) were used at 10−6 and 10−5 M. Reporter-introduced cells were treated with indicated drugs for 24 h before the adipogenic induction. (e) Chromatin formation on transfected reporter plasmid. Pan-histone H3 (white bars) and control IgG (black bars) levels were analysed both on endogenous and transgenic PGC-1α promoter. (f) H3K4 di-methylation level of the reporter vector after vehicle (black bars) or 10−4 M TC (orange bars) treatment. Values are normalized to the enrichment level of panH3. (g) LSD1-binding on the reporter vector. Values are normalized to the enrichment level of panH3. Values are mean±s.d. of triplicate samples. *P<0.05, **P<0.01 versus control siRNA or vehicle by Student's t-test.

