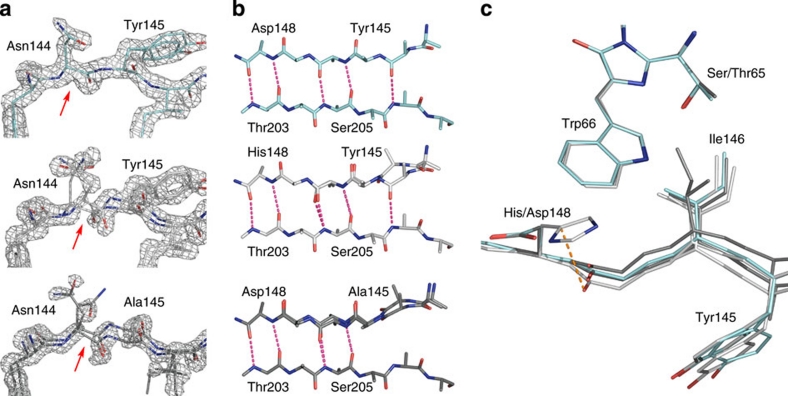
Figure 2. Structural characterization of SCFP3A.
(a) Comparison of the electron density of the seventh strand in various CFP mutants. The 2Fo–Fc map is superimposed on residues 143–146 and contoured at a 1.6σ level for SCFP3A (light blue), ECFP (light grey) and Cerulean (dark grey). Red arrows indicate the position of the Cα–C bond in Asn144, on which the electron density is discontinuous in ECFP and Cerulean, and continuous in SCFP3A. As a consequence, the structures of ECFP and Cerulean had to be modelled with two conformations of the main chain of the seventh strand, whereas SCFP3A could be modelled with one single conformation. (b) H-bond pattern bridging the seventh and tenth strands in SCFP3A, ECFP and Cerulean (from top to bottom). The alternate conformation of the seventh strand is shown in white. (c) Positions of residues 145, 146 and 148 on the seventh strand relative to the chromophore in ECFP, Cerulean and SCFP3A.

