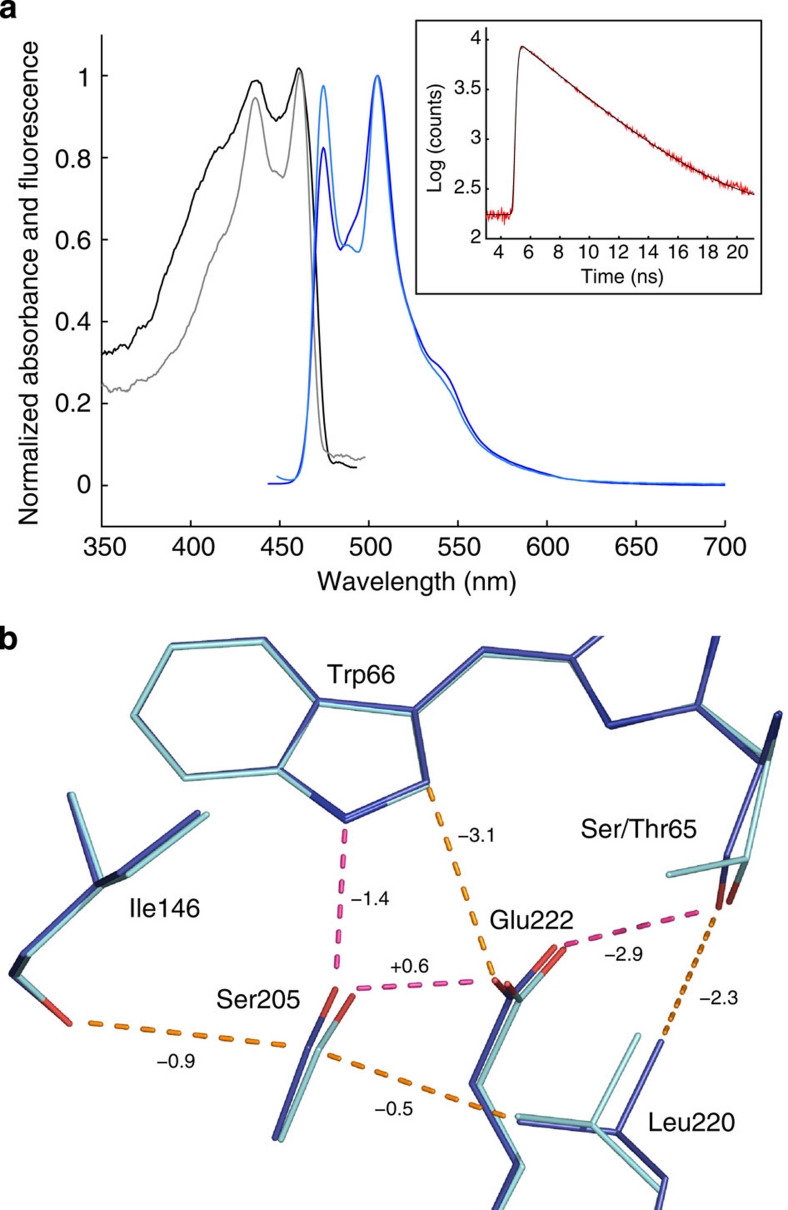
Figure 3. Structural characterization of mTurquoise.
(a) Ultraviolet–visible light absorption (black) and fluorescence emission (blue) spectra of mTurquoise in solution (light colours) and in the crystalline state (dark colours) at 100 K. Inset: TCSPC histogram of a mTurquoise crystal recorded at room temperature, of which a fluorescence lifetime of 3.55 ns is calculated. (b) Superimposition of the models of SCFP3A (cyan) and mTurquoise (blue). Hydrogen bonds are drawn in magenta, and vdW contacts are indicated in orange. Interaction energy gains between SCFP3A and mTurquoise in the excited state are indicated in kJ mol−1 on the corresponding H-bonds or vdW contacts.

