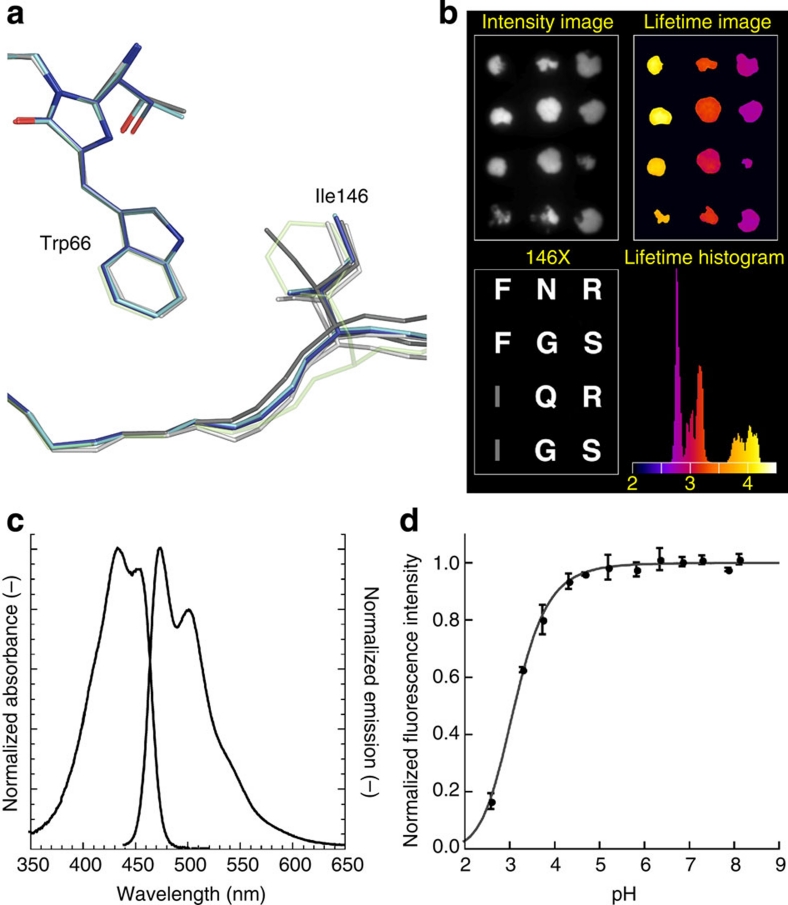
Figure 4. Identification of mTurquoise2 and spectroscopic characterization.
(a) Comparison of the Ile146 position in all known structures of CFP, highlighting its weak interaction with the chromophore (ECFP: light grey; Cerulean: dark grey; SCFP3A: light blue; mTurquoise: dark blue). The position of Phe146 in mTurquoise2 is shown as transparent green by anticipation. (b) Fluorescence lifetime imaging of bacterial colonies expressing 146X variants of mTurquoise with fluorescence intensities (upper left), and fluorescence modulation-based lifetimes (upper right). Sequencing revealed the identity of the residue at position 146 (lower left), with the corresponding residue in mTurquoise depicted in grey. Colonies with phenylalanine at 146 show an increased fluorescence lifetime, which can be discerned in the lifetime histogram as a separate peak around 4 ns, whereas the lifetime of mTurquoise is around 3.8 ns. The lifetime image is pseudo-coloured according to the scale shown in the histogram (values in ns). (c) Normalized absorption and fluorescence emission spectra of mTurquoise2. (d) pH dependence of mTurquoise2 fluorescence. Each point corresponds to the average of three measurements and is represented with the standard deviation. Data point interpolation (dark grey) results in a pKa of 3.1.

